Facebook
 X
X
 Pinterest
 Copy Link
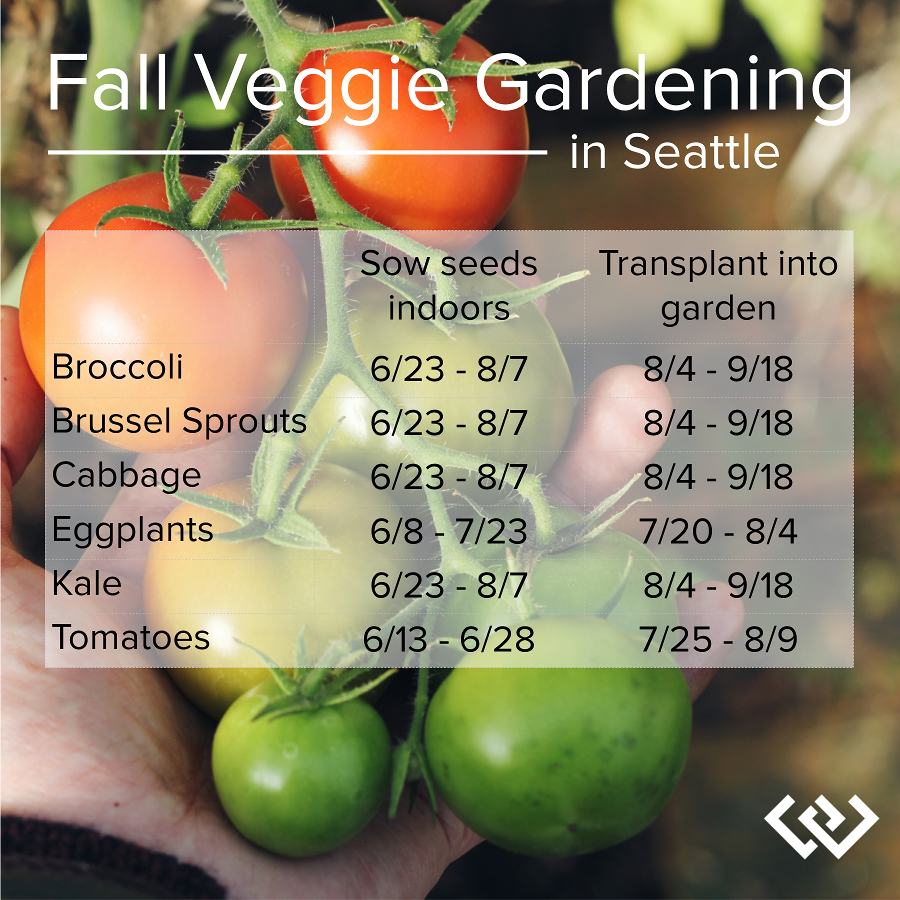
 It’s not too late! If you’re thinking about planting some fresh veggies but haven’t started yet, you still have time to get things in the ground for a late summer/early fall harvest. On average, the Puget Sound’s frost-free growing season is mid-March through mid-November, so with a little knowledge of when and how to start things, you can still see a bountiful harvest this year.
Some plants can be direct seeded into your garden, while others should be started indoors before being transplanted to your garden space. Deciding what to grow is the fun part! Plant what you like to eat, keeping in mind that some plants do better in our area than others.
Broccoli is arguably one of the most productive veggies you can grow in this area, although it can be vulnerable to root maggots and aphids. Giant Italian Parsley is easy to grow, highly productive, and expensive in the grocery store. Leeks are another that can be costly to buy in the store but trouble-free to grow in your own small space. Chard, Kale, Lettuce and Arugula are all full of vitamins and great for Northwest gardens. Carrots, Snap Peas, Snap Beans, Tomatoes and Basil all taste amazing fresh from the garden and grow relatively well in this area.
Check out the great resources at Garden.org for a full list of when to plant all these vegetables and more. They have detailed timelines for both spring and fall gardening; as well as information on transplanting seedlings vs. direct-sowing seeds.