
 Facebook
 X
X
 Pinterest
 Copy Link
North Snohomish County Housing Market Trends Copy
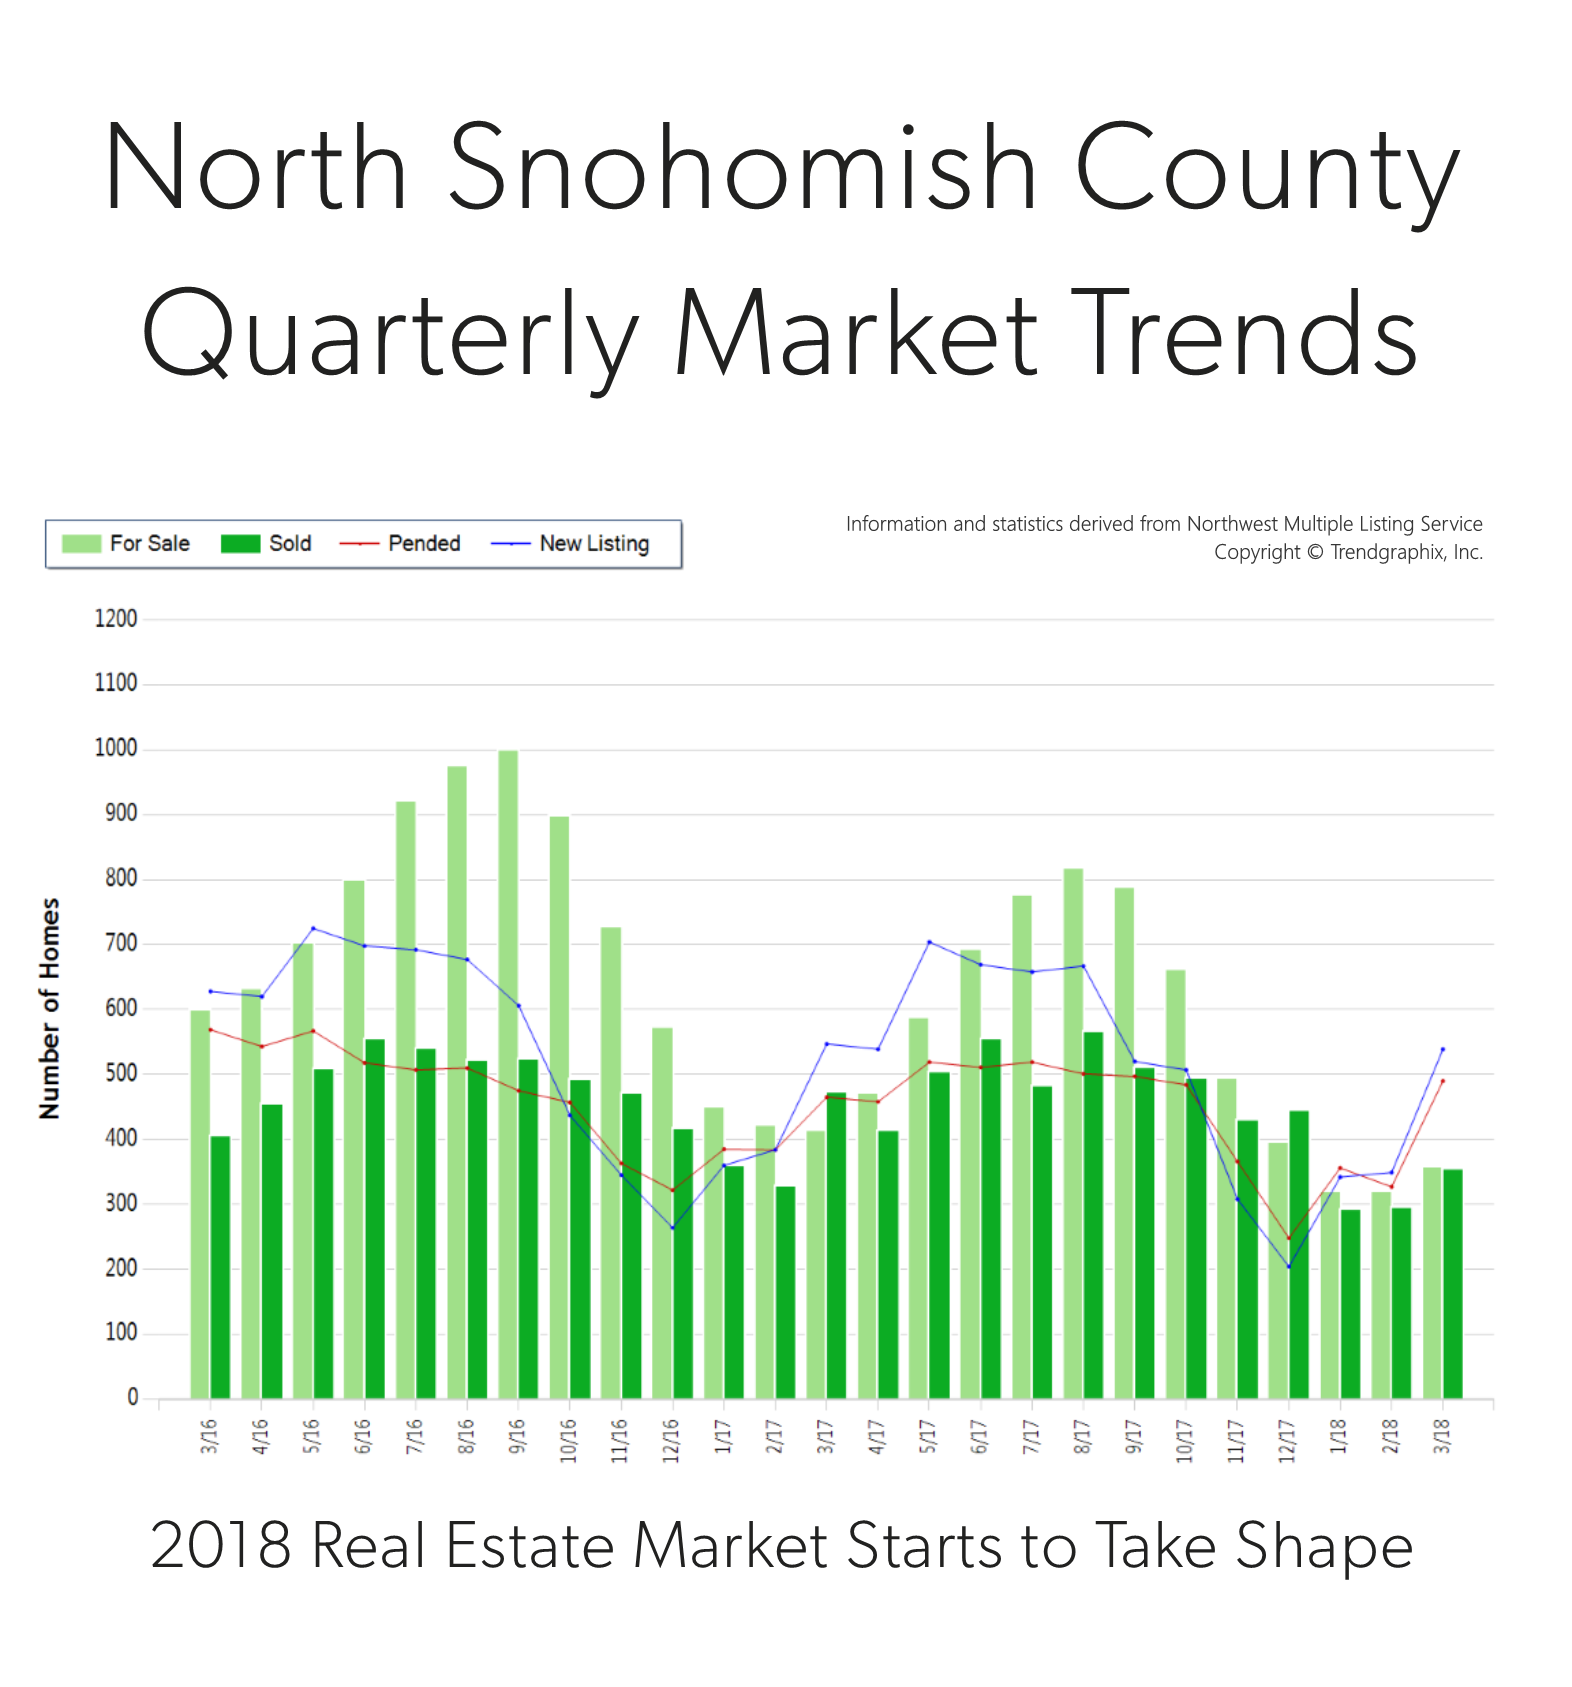

North Snohomish County Quarterly Market Trends
It is the time of year when our market starts to take off. Spring is here and we are starting to see seasonal increases in inventory. In fact, there was a 54% increase in new listings in March compared to February. That increase was matched by a 50% rise in pending sales, illustrating very strong demand for housing in your area. Last month, the average list-to-sale price ratio was 100%, and average days on market was 35 days. We ended the quarter with 0.7 months of inventory – the lowest level yet. More inventory would be absorbed by happy buyers looking for more selection and would help temper price growth, which is up 12% year-over-year.
North Snohomish County is one of the most affordable markets in the area. In fact, the median price in March was 28% higher in south Snohomish County. Buyers are migrating to the area, especially if they don’t have to commute into the city. Sellers are enjoying amazing returns due to this phenomenon, and buyers are securing mortgages with minor debt service due to low interest rates. This is a very strong seller’s market, but buyers who are securing a home are already enjoying appreciation in equity.
This is only a snapshot of the trends in north Snohomish County; please contact me if you would like further explanation of how the latest trends relate to you.
Eastside Median Home Prices Hit $927,000!
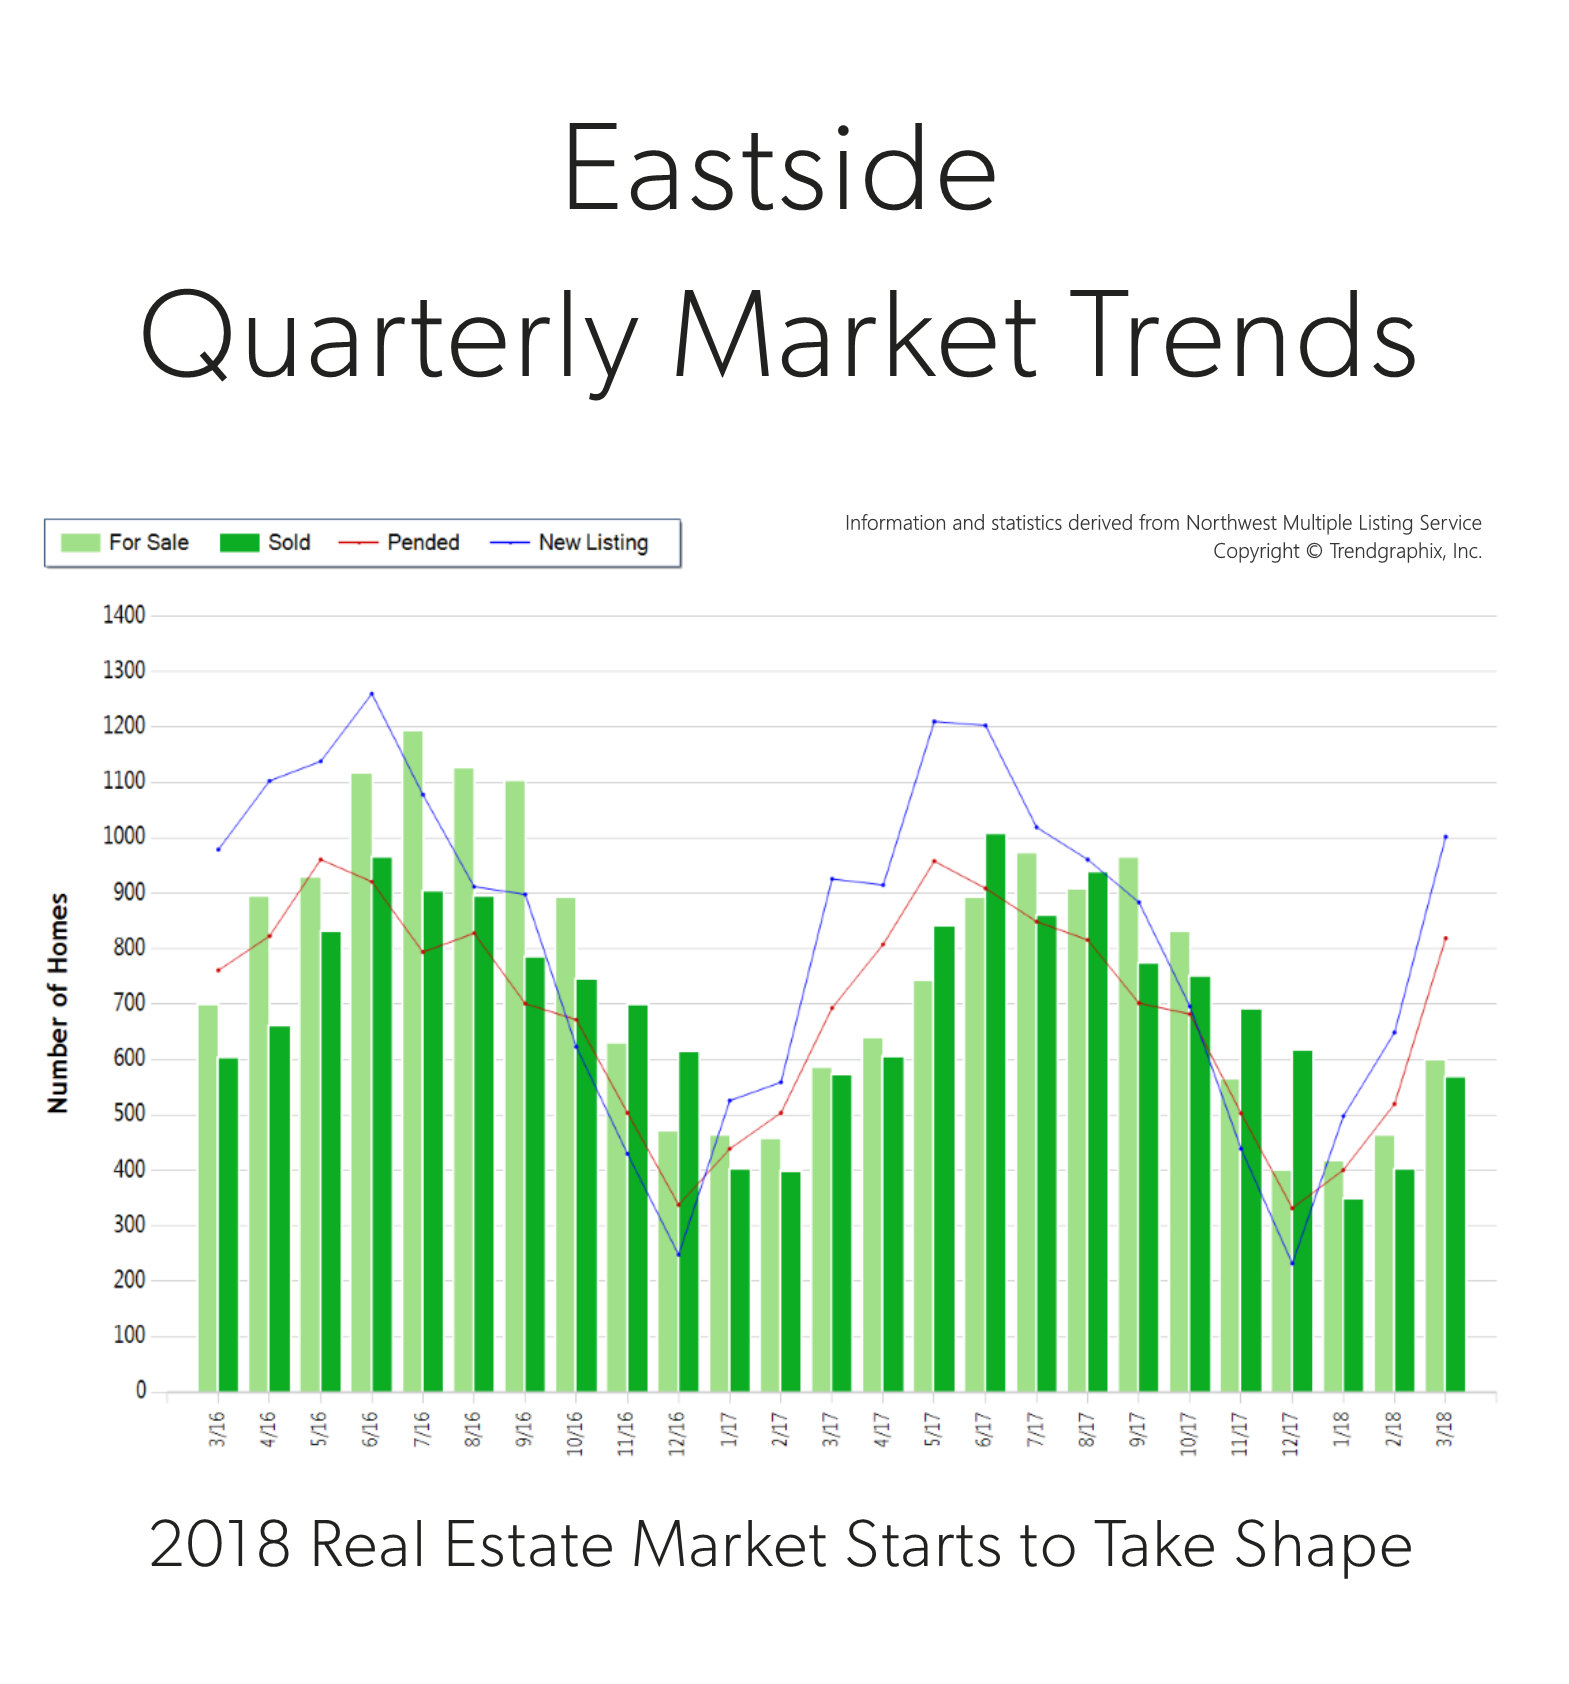

Eastside Quarterly Market Trends
It is the time of year when our market starts to take off. Spring is here and we are starting to see seasonal increases in inventory. In fact, there was a 54% increase in new listings in March compared to February. That increase was topped by a 58% rise in pending sales, illustrating very strong demand for housing in your area. Last month, the average list-to-sale price ratio (the amount the sale price topped the list price) was 103%, indicating that multiple offers were the norm. We ended the quarter with 0.7 months of inventory – the lowest level yet. More inventory would be absorbed by happy buyers looking for more selection and would help temper price growth, which is up 14% year-over-year.
Eastside real estate has a very high premium due to close-in commute times and desirable neighborhoods. In fact, the median price in March was $927,000! Sellers are enjoying amazing returns due to this phenomenon, and buyers are securing mortgages with minor debt service due to low interest rates. This is a very strong seller’s market, but buyers who are securing a home are already enjoying appreciation in equity.
This is only a snapshot of the trends on the Eastside area; please contact me if you would like further explanation of how the latest trends relate to you.
North Snohomish County Housing Market Trends
North Snohomish County Quarterly Market Trends
It is the time of year when our market starts to take off. Spring is here and we are starting to see seasonal increases in inventory. In fact, there was a 54% increase in new listings in March compared to February. That increase was matched by a 50% rise in pending sales, illustrating very strong demand for housing in your area. Last month, the average list-to-sale price ratio was 100%, and average days on market was 35 days. We ended the quarter with 0.7 months of inventory – the lowest level yet. More inventory would be absorbed by happy buyers looking for more selection and would help temper price growth, which is up 12% year-over-year.
North Snohomish County is one of the most affordable markets in the area. In fact, the median price in March was 28% higher in south Snohomish County. Buyers are migrating to the area, especially if they don’t have to commute into the city. Sellers are enjoying amazing returns due to this phenomenon, and buyers are securing mortgages with minor debt service due to low interest rates. This is a very strong seller’s market, but buyers who are securing a home are already enjoying appreciation in equity.
This is only a snapshot of the trends in north Snohomish County; please contact me if you would like further explanation of how the latest trends relate to you.
How Much Has Your Home Appreciated since 2014?
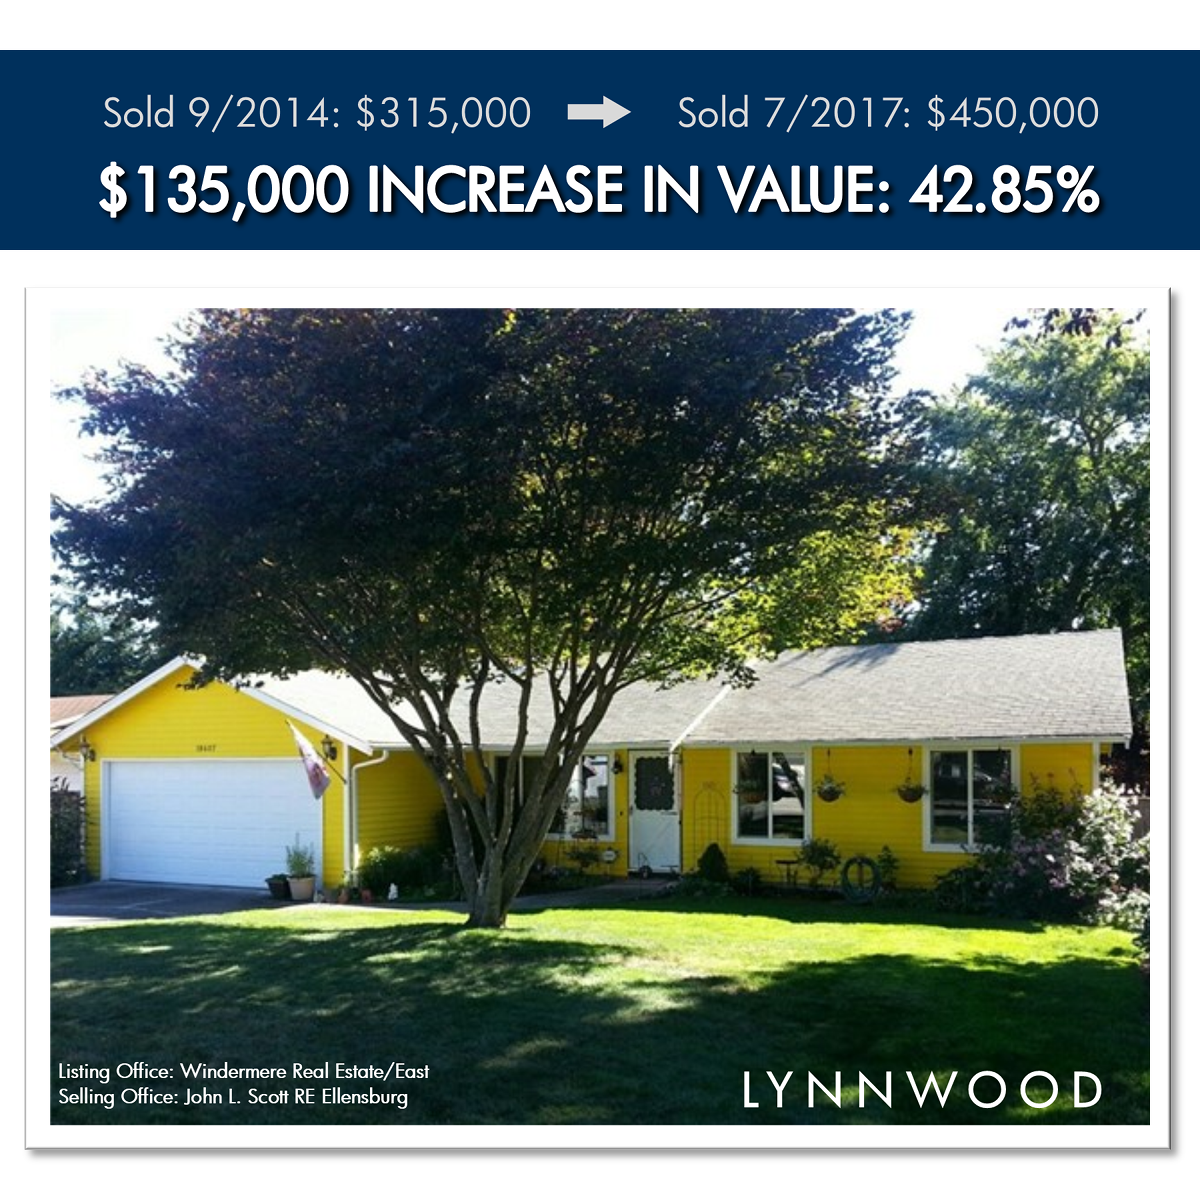

Price Appreciation since 2014
Lynnwood:
Do you know what your home is worth? This is an example of an actual home that was sold in 2014 and again in 2017, with no remodel or significant improvements in between – for a resounding 42.85% increase in value! This is actual, pound-for-pound appreciation in south Snohomish County. Since 2014, home values in the greater Seattle area have grown over 10% each year. Contact me if you want to chat about your home’s value!
